
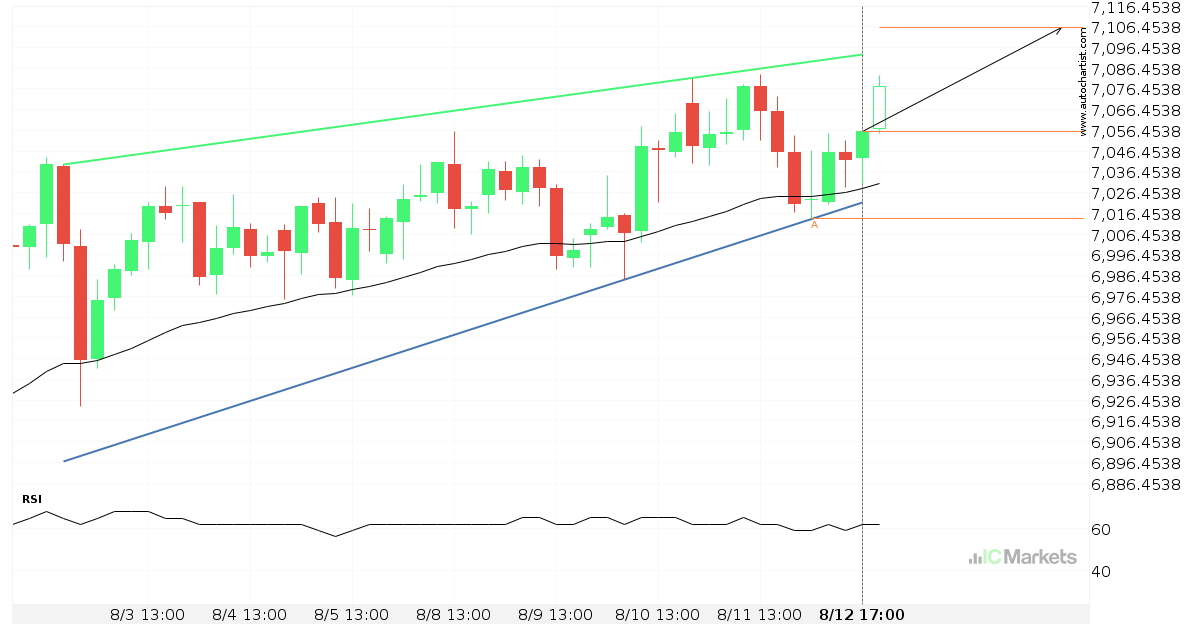
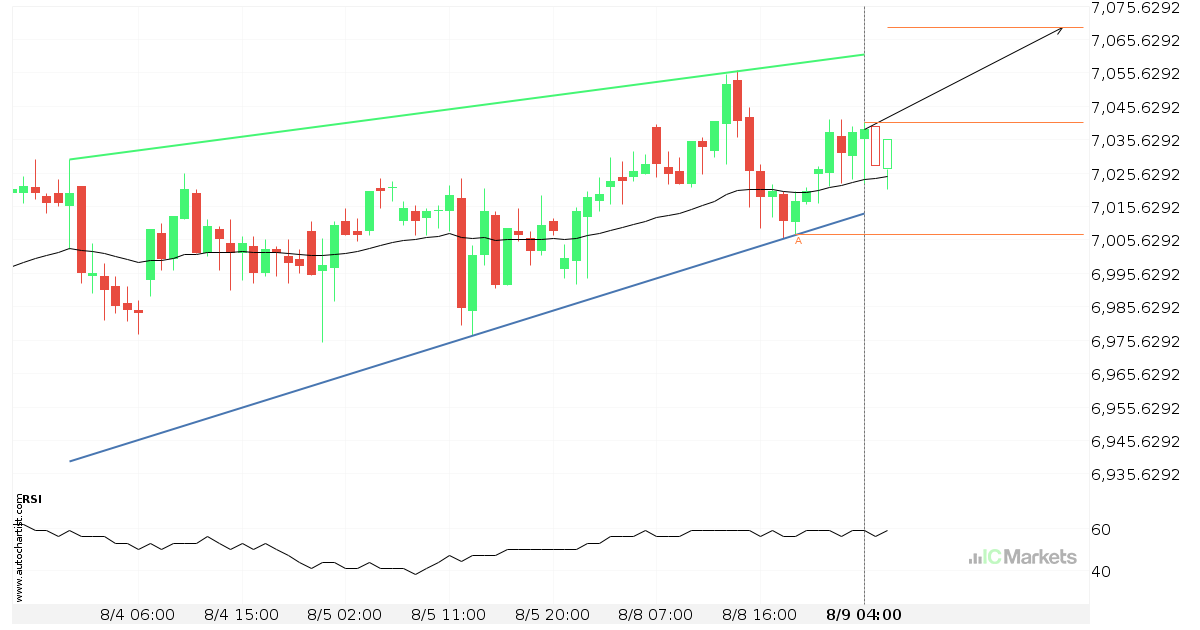
Will Australia 200 Index have enough momentum to break resistance?
Australia 200 Index is heading towards the resistance line of a Rising Wedge and could reach this point within the next 3 days. It has tested this line numerous times in the past, and this time could be no different from the past, ending in a rebound instead of a breakout. If the breakout doesn’t […]
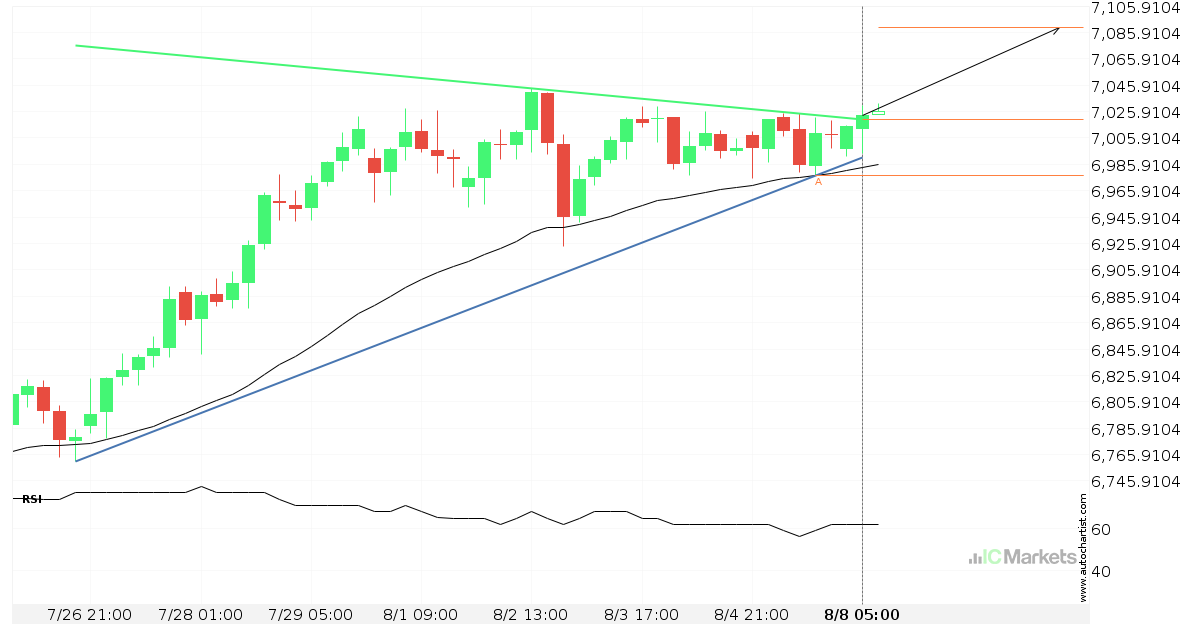
Either a rebound or a breakout imminent on Australia 200 Index
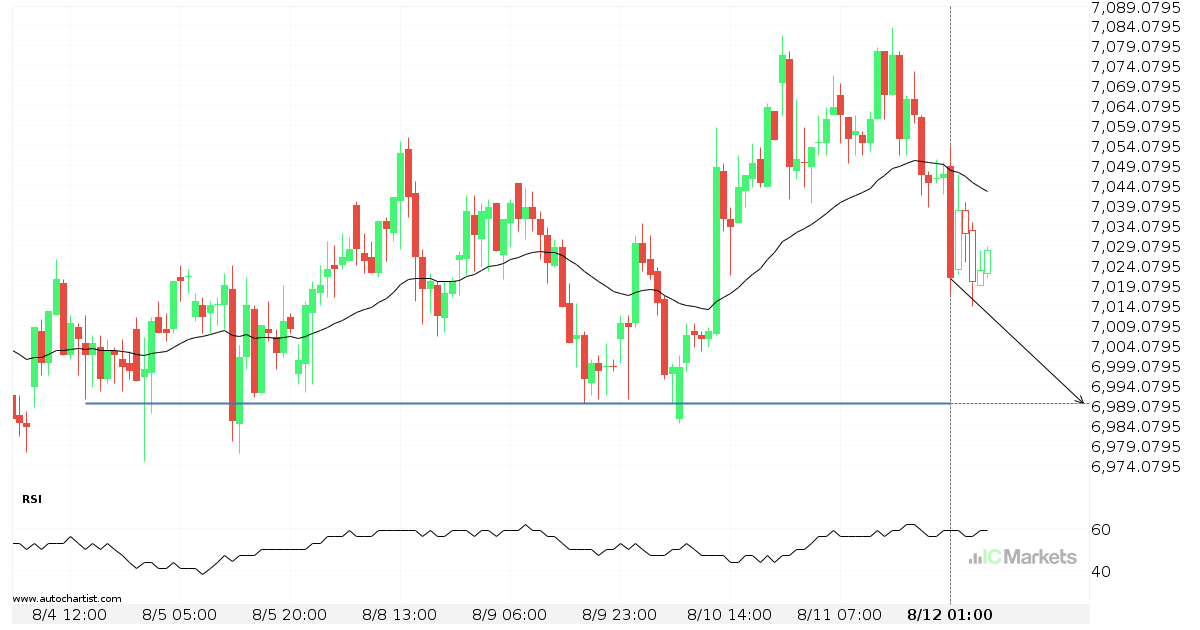
Australia 200 Index is heading towards a line of 6989.6299. If this movement continues, the price of Australia 200 Index could test 6989.6299 within the next 2 days. But don’t be so quick to trade, it has tested this line numerous times in the past, so this movement could be short-lived and end up rebounding.
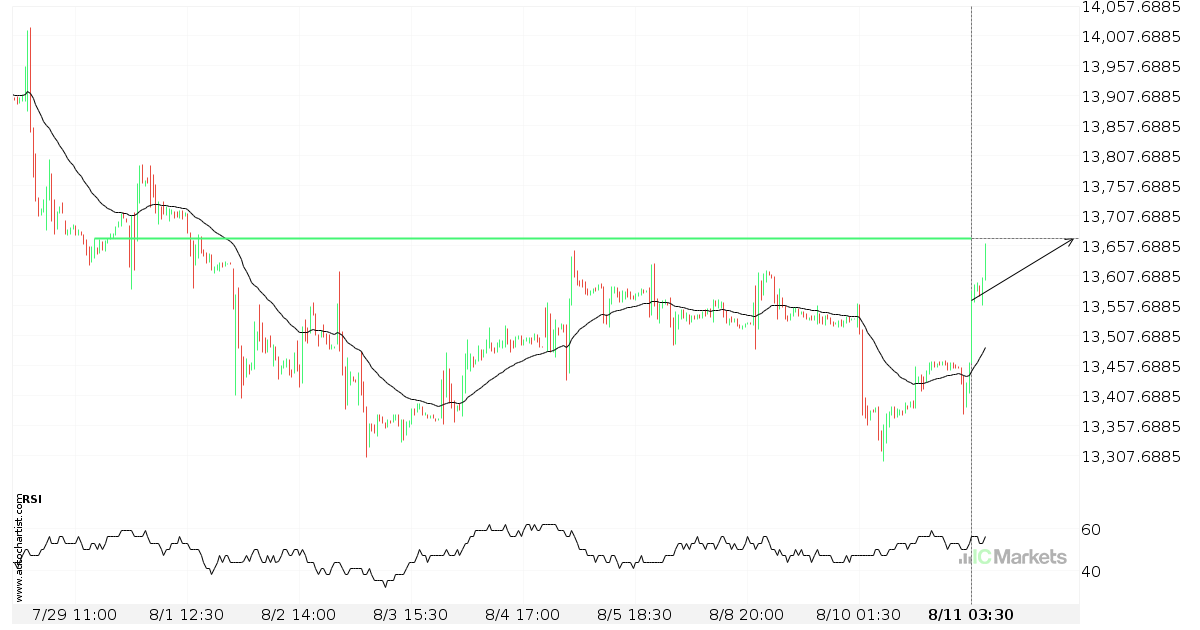
Either a rebound or a breakout imminent on FTSE China A50 Index
FTSE China A50 Index is heading towards a line of 13669.5303. If this movement continues, the price of FTSE China A50 Index could test 13669.5303 within the next 2 days. But don’t be so quick to trade, it has tested this line numerous times in the past, so this movement could be short-lived and end […]

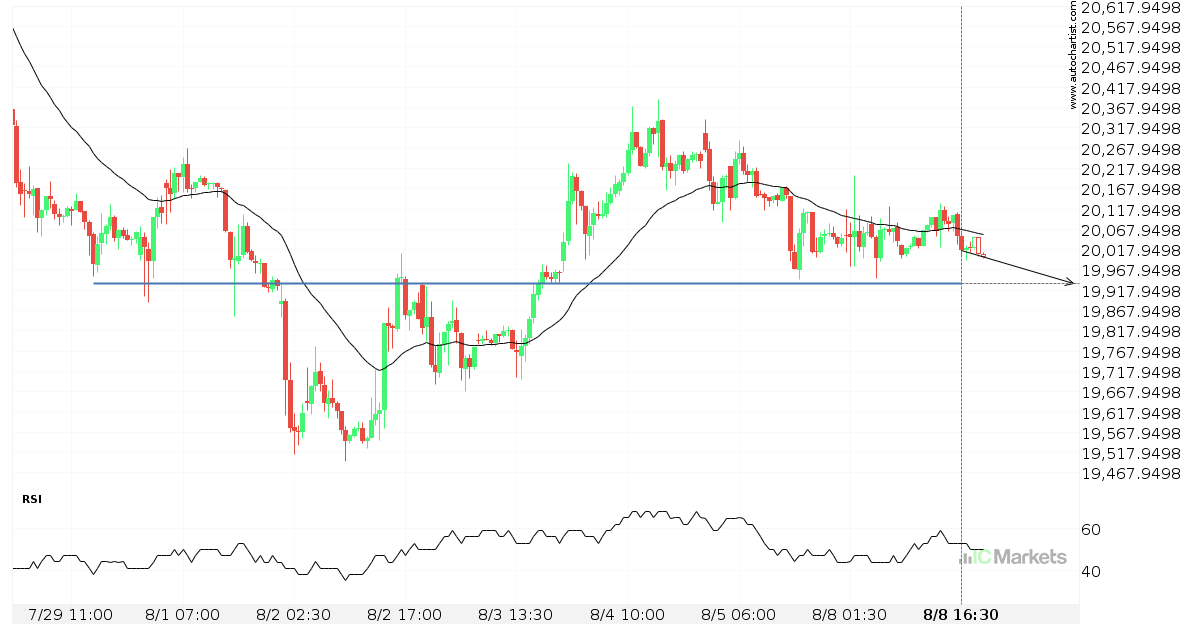
Important price line breached by Hong Kong 50 Index
Hong Kong 50 Index has broken through 19943.3008 which it has tested numerous times in the past. We have seen it retrace from this price in the past. If this new trend persists, Hong Kong 50 Index may be heading towards 19803.0098 within the next 9 hours.
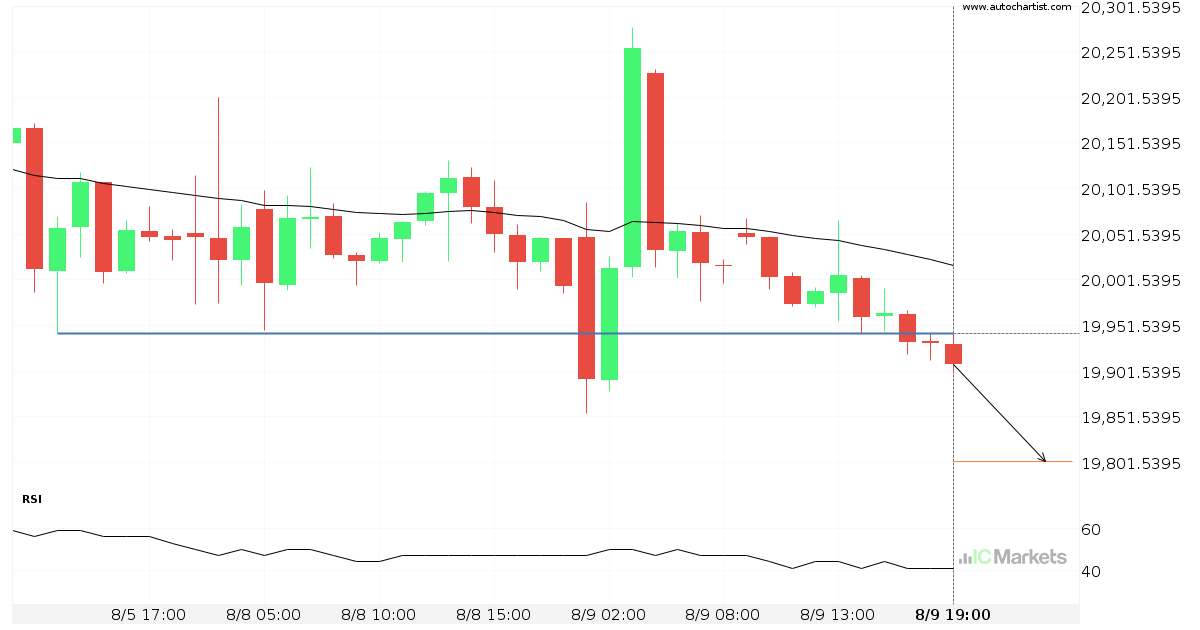
Possible breach of resistance level by Australia 200 Index
Australia 200 Index is moving towards a resistance line which it has tested numerous times in the past. We have seen it retrace from this line before, so at this stage it isn’t clear whether it will breach this line or rebound as it did before. If Australia 200 Index continues in its current trajectory, […]

Breach of important price line imminent by Hong Kong 50 Index
Hong Kong 50 Index is moving towards a line of 19934.0996 which it has tested numerous times in the past. We have seen it retrace from this position in the past, so at this stage it isn’t clear whether it will breach this price or rebound as it did before. If Hong Kong 50 Index […]
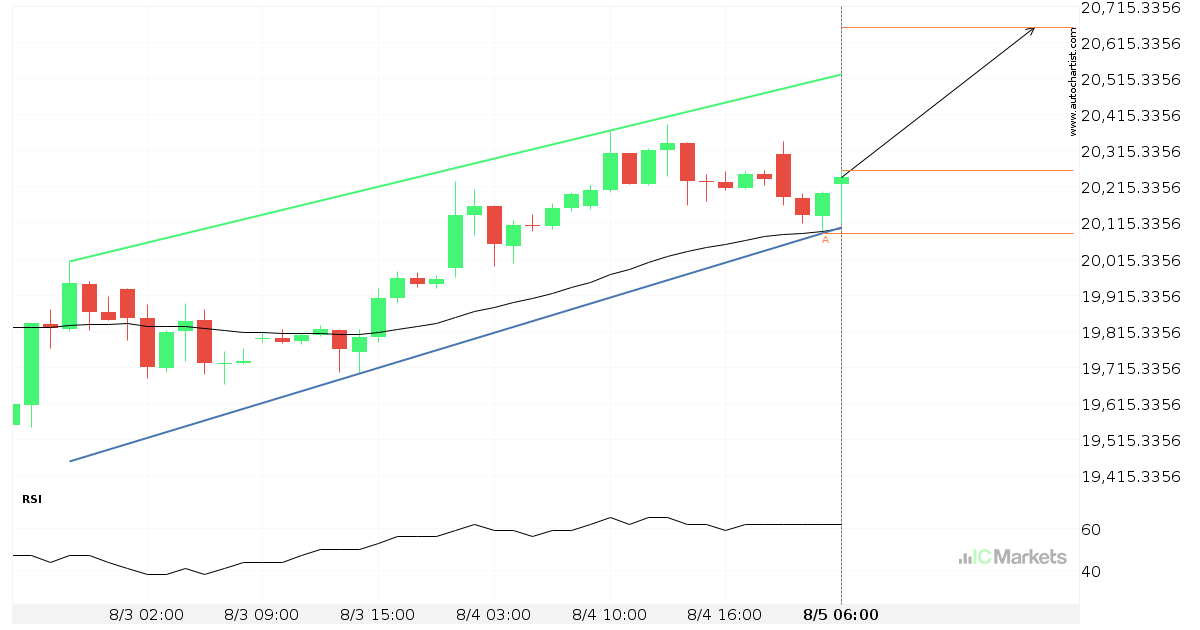
Possibility of big movement expected on Australia 200 Index
Australia 200 Index has broken through a resistance line of a Triangle and suggests a possible movement to 7089.4766 within the next 3 days. It has tested this line in the past, so one should probably wait for a confirmation of this breakout before taking action. If the breakout doesn’t confirm, we could see a […]
Hong Kong 50 Index approaching resistance of a Channel Up
Hong Kong 50 Index is approaching the resistance line of a Channel Up. It has touched this line numerous times in the last 3 days. If it tests this line again, it should do so in the next 12 hours.